Brisbane Property — Is the Affordability Story Starting to Break?
Everyone's got Brisbane on their buy list right now.
The Olympics. The infrastructure spend. The population growth story. Interstate migration. It's been the dominant narrative in Australian property for the last three years and on the surface, it makes sense.
But here's the thing about narratives — they can run well ahead of the numbers. And when you actually sit down with the data, Brisbane's affordability story is looking a lot more strained than the headlines suggest.
So let me break it down.
What the Years-to-Own Figure Actually Tells Us
One of the most important metrics we use at Baker Advocates when assessing a market is years-to-own. It's exactly what it sounds like — how long it would take someone on local median household incomes to actually purchase a property in that area, at current prices.
It cuts through the noise. It doesn't care about Olympic timelines or infrastructure announcements. It just tells you whether the people who live in a place can actually afford to buy there.
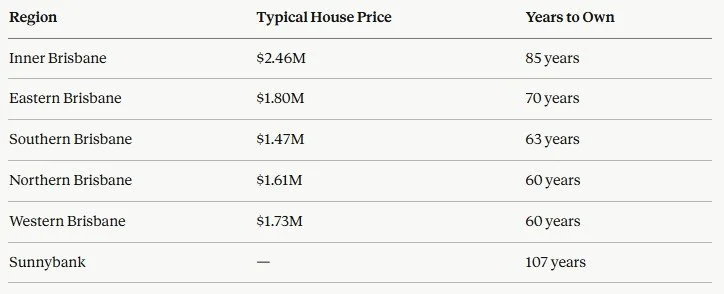
Here's what that looks like across Brisbane's regions right now, based on HTAG Analytics data for the March 2026 quarter:
“If affordability breaks so does the floor under property prices”
Sunnybank. One of the most recommended suburbs in Queensland property circles right now. 107 years to own on local incomes.
That is not a typo.
When Renters Outnumber Owners, Something Has Shifted
Years-to-own is one signal. But there's another metric that tells an equally important story the renter-to-owner ratio.
In Chermside, one of Northern Brisbane's most talked-about growth corridors, the renter-to-owner ratio is currently sitting at 0.63. That means renters now outnumber owner-occupiers in the suburb.
Why does that matter for investors?
Because sustained capital growth is predominantly driven by owner-occupier demand. When a market transitions from owner-dominated to renter-dominated, it signals that the pool of buyers who can actually afford to purchase and who drive competitive bidding and price growth is shrinking.
It doesn't mean rents won't hold up. It doesn't mean the suburb has no future. But it does mean the engine that drives capital growth is running with less fuel than it used to.
Buyer Interest Is Already Reflecting This
Here's one more data point worth sitting with.
Buyer interest scores across Brisbane's LGA regions measured through HTAG's HAPI index, which tracks actual buyer search activity are currently sitting at 1 to 2 out of 10.
Not 6. Not 8. One to two.
That is not the footprint of a market building momentum for its next growth leg. That is a market where affordability has already done significant damage to the active buyer pool.
When locals can't buy in, and interstate buyers who drove the 2021 to 2023 wave have already made their move, who is left to push prices higher?
I'm Not Saying Avoid Queensland
This is important context, so let me be direct about it.
I am not saying Queensland is uninvestable. I am not saying the Olympics infrastructure story is fake. Both of those things are real and they matter.
What I am saying is that investing in a city is not a strategy. Brisbane is not one market it is dozens of micro-markets with vastly different supply dynamics, income profiles, and affordability ceilings. The suburbs that still have room to run are not the same ones dominating the social media content cycle right now.
Chasing a headline and calling it due diligence is how investors make expensive mistakes. The data should come first, always.
At Baker Advocates, every market recommendation we make is grounded in exactly this kind of analysis looking at real income data, real buyer demand signals, and real affordability metrics before we ever recommend a client commit capital anywhere.
The Question Worth Asking
If it takes 60, 70, or 107 years for locals to buy into a suburb on current incomes, who exactly is going to drive the next leg of price growth?
That's the question the Brisbane bulls need to answer.
If you want to understand where the data actually stacks up for investors right now in Queensland and across the country book a discovery call with us below. We'll show you the numbers, not just the narrative.
Book a Discovery Call → bakeradvocates.com.au/discovery-call
Data source: HTAG Analytics warehouse, March 2026 quarter, houses. Years-to-own calculated on local median household incomes. All figures accurate at time of publication.