
Two Investors. Same Budget. Very Different Outcomes.
Two Investors. Same Budget. Very Different Outcomes.
In 2021, two investors had the same budget, the same goal, and the same target region. They made different decisions. Five years later, the data tells you everything about why one looks smarter than the other — and it’s not the one most people would guess.
Two investors. Same month. South-East Queensland, 2021.
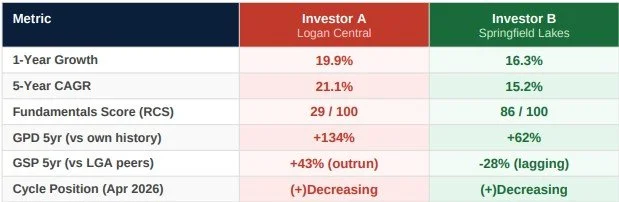
Investor A bought in Logan Central. Strong community feel, cheap entry point, everyone was talking about it. One-year growth at the time was already climbing. They bought the momentum. Investor B bought in Springfield Lakes. Less buzz. The suburb had quietly underperformed its Ipswich LGA peer group for years. But the fundamentals score was 86 out of 100. They bought the structure.
Fast forward to today.
Both markets have grown. Logan Central compounded at 21.1% annualised over five years — one of the strongest runs in the region. Investor A looks smart at every dinner party. But here’s what the data shows underneath that headline number.
The data that doesn’t make the headlines
HTAG Analytics Warehouse · April 2026 · Houses · South-East QLD
What the data was always saying
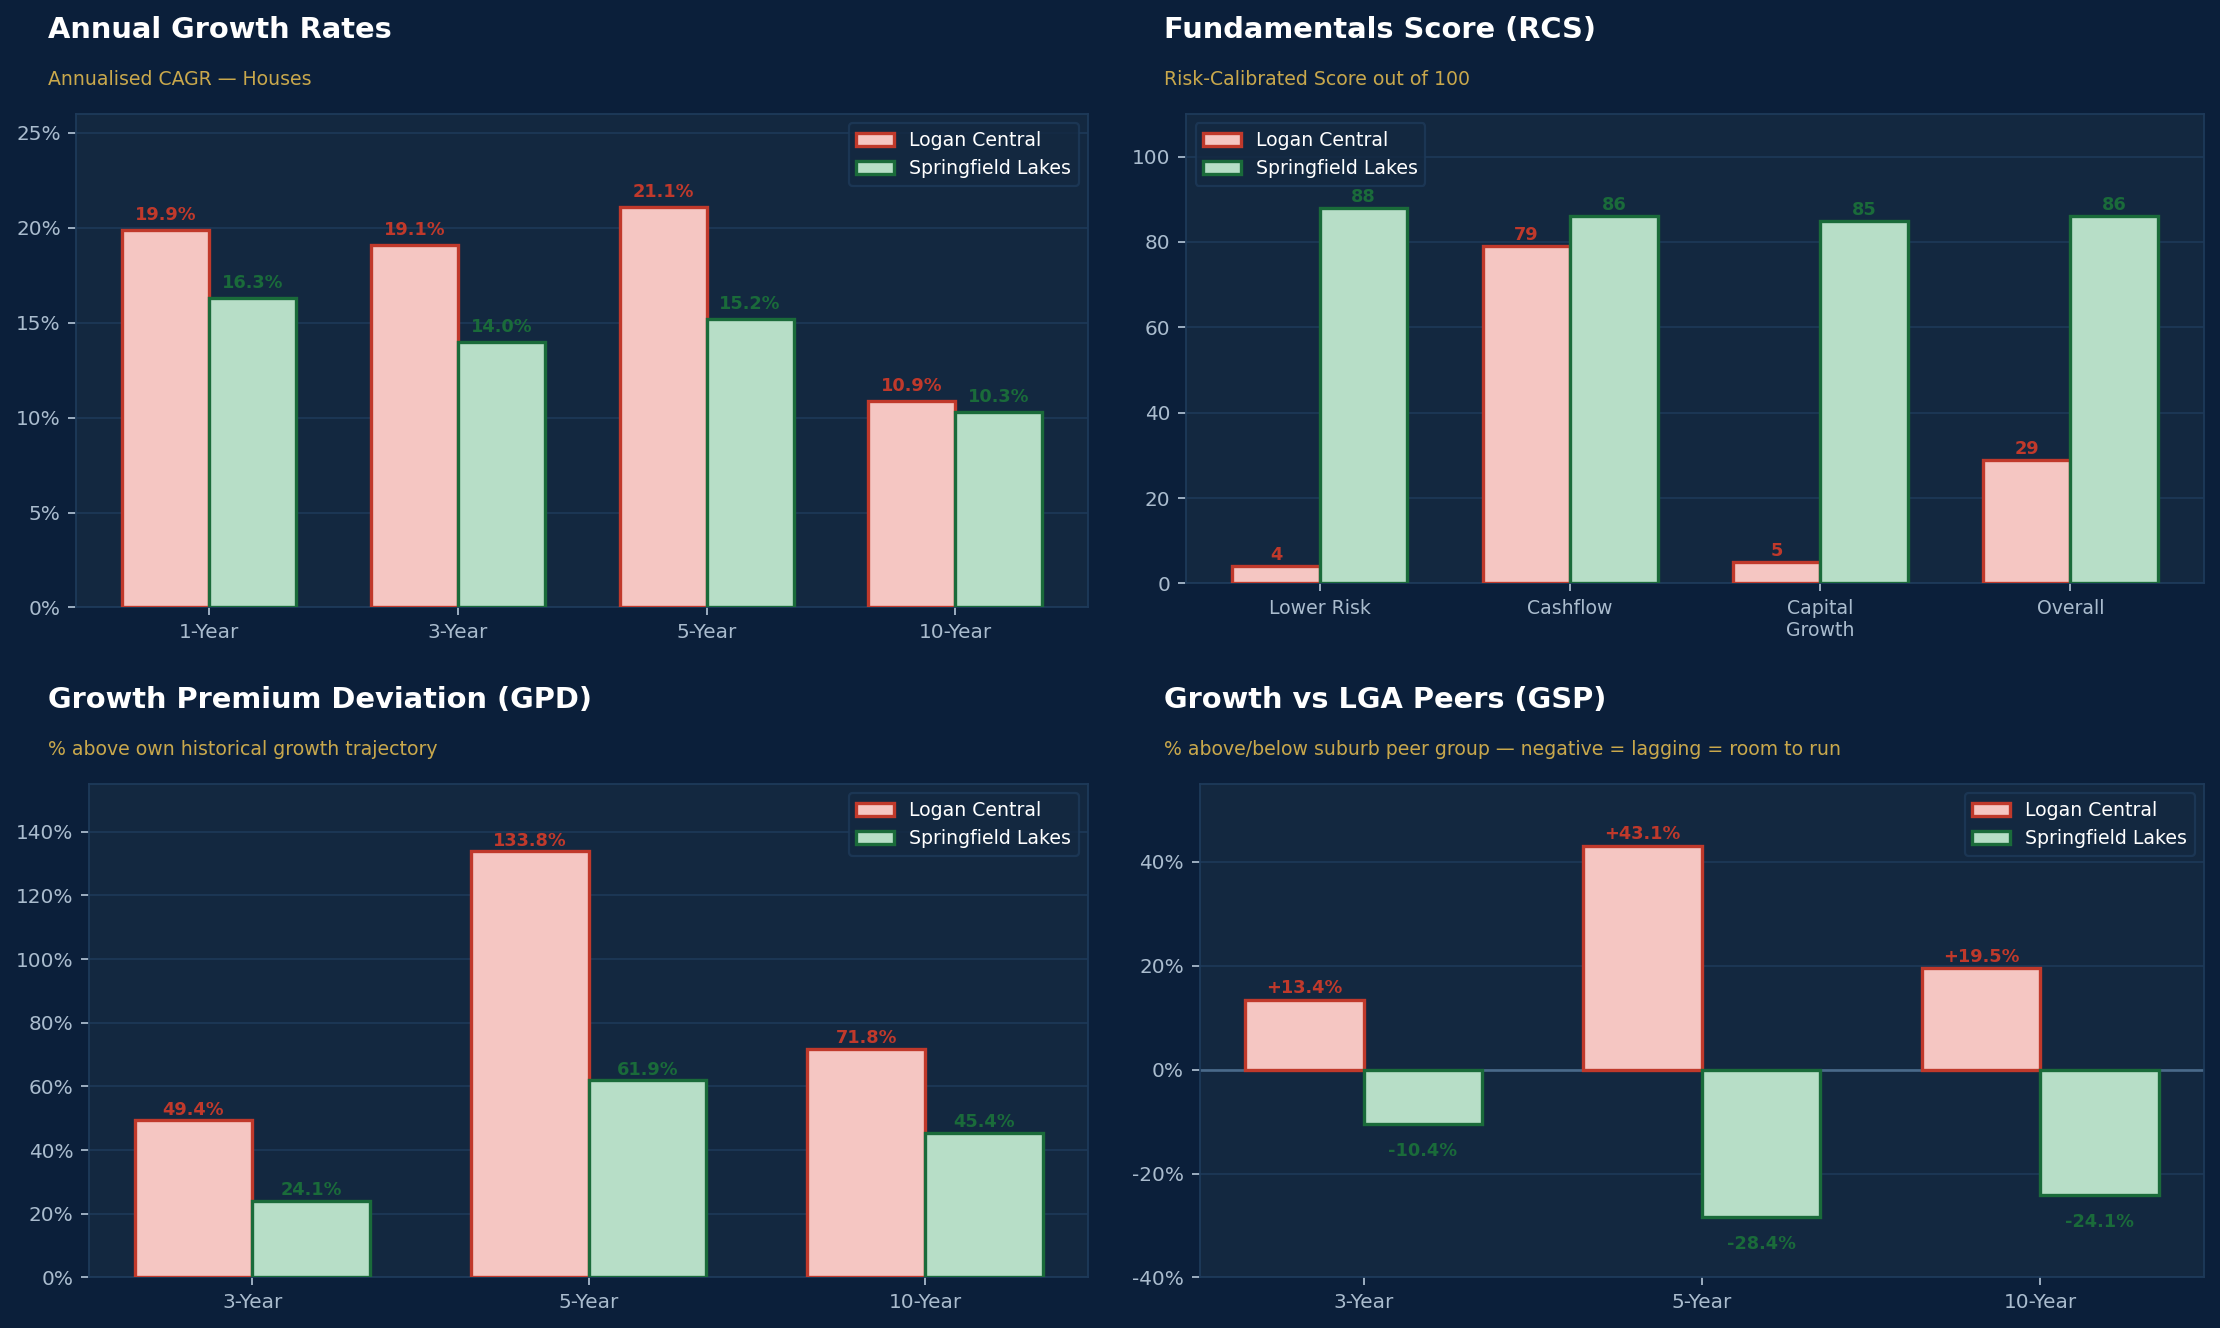
Logan Central’s five-year run was real. Prices compounded at 21.1% annualised. But underneath that growth, a different metric told a different story.
By April 2026, Logan Central had outperformed its own historical growth trajectory by 134%. That figure called GPD, or Growth Premium Deviation measures how far a suburb has stretched beyond its own historical capacity. A high GPD doesn’t mean a market is bad. It means the market has already extracted most of what it structurally had to give. The upside is narrower. The entry risk is higher.
Springfield Lakes sat at 62% GPD over the same period. Still above its own history but far less exhausted. And critically, it had underperformed its Ipswich LGA peer group by 28% over five years. That gap between a suburb’s fundamentals quality and its relative performance against peers is not a warning sign. It is the definition of structural upside
““Investor A bought a market that had already started telling its story. Investor B bought one that hadn’t finished telling it yet.””
Where both markets stand today
As of April 2026, both suburbs are in a (+)Decreasing cycle phase growth is still positive, but the rate is slowing. That is a normal late-cycle position for South-East QLD after several strong years. Neither market is collapsing.
But the forward picture looks different. Logan Central’s projected annual capital growth range is -5% to +13%. Its structural score — 29 out of 100 — reflects real risk: the market has outrun its fundamentals. Rent growth projections remain positive, which provides some buffer, but the capital growth case is harder to justify at current prices. Springfield Lakes projects a similar range of -6% to +14%. But with an RCS of 86, significantly less cycle exhaustion, and a peer-group lag still to close, the structural case for continued growth is much stronger. It still has the quality to support the price.
The principle that never changes Raw growth figures are backward-looking.
They tell you where a market has been. The metrics that matter for forward decisions are the ones that reveal how much of a market’s structural capacity has already been consumed. Investor A made a reasonable decision based on the information most people use. Investor B made a better decision by asking a different question: not just what has this market returned but how much of its own capacity has it already used? The difference between a good return and a great one is rarely the growth figure. It’s when in the story you arrived and whether the story still has chapters left to write.