
The Most Important Property Chart Nobody Is Talking About Right Now
The Chart That Looks Like a V
There is a chart that should be on every property investor's screen right now. It does not appear in mainstream headlines. Your financial news feed is not leading with it. But it tells you everything you need to know about where we are and what is coming.
It looks like a V.
And the investors who understand what that V means are quietly positioning themselves right now.
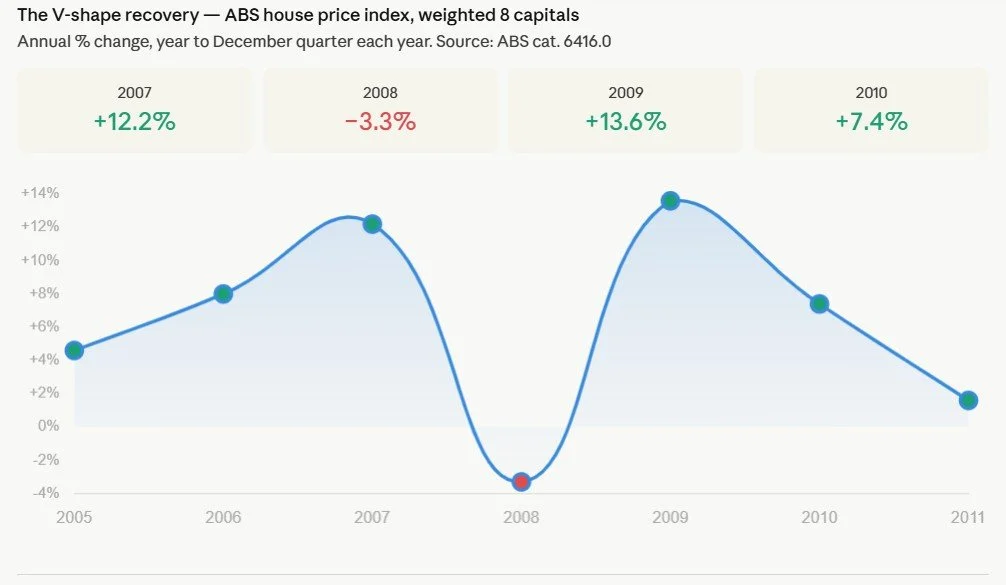
The potential V-shape proeprty market recovery post the peak is one not to be missed.
What Happened in 2008 and Why It Matters in 2026
In 2008, Australian national house prices fell 3.3%.
That was the full extent of the damage during one of the worst global financial crises in modern history. A crisis that collapsed banks, froze credit markets, and wiped out economies around the world.
Then 2009 happened.
Prices surged 13.6% nationally in a single year. That was not a gradual recovery. That was not a slow rebuild of confidence. It was violent, fast, and it rewarded only the investors who were already positioned when it arrived.
The city-level numbers told an even sharper story:
Melbourne inner suburbs: estimated 20–25%
Darwin: 13.6%
Sydney: 12.8%
Perth: 11.5%
The V-shape is obvious now, looking back. But here is the part that most people miss.
The investors who waited did not just miss the upswing. By the time confidence returned, the lending environment had shifted underneath them. Banks had repriced risk. Serviceability buffers had tightened. Even strong borrowers were finding their borrowing capacity cut. The window was open during the fear. It closed quietly while people were still waiting to feel comfortable.
Source: ABS
Fast Forward to 2026: The Parallels Are Striking
Look at what is happening in Australia today.
Rising interest rates. A Middle East conflict pushing petrol prices higher. Consumer confidence sliding. The RBA flagging declining GDP ahead.
This feels uncomfortable. It is meant to feel uncomfortable. Fear is the price of entry on the left side of the V.
But here is what the data tells us underneath the noise.
Australian property did not fall just 3.3% during the GFC because of luck. It fell just 3.3% because of structure. Chronic undersupply. Near-record low vacancy rates sitting at 1.6%. A population growing faster than we can build homes to house it.
That same structural reality exists today. In fact, in many ways, it is more acute now than it was in 2008.
The 18.6-Year Property Cycle and What It Tells Us
Across 200 years of Western economic history, the 18.6-year real estate cycle has played out with remarkable consistency. It is not a theory. It is a pattern embedded in the data across multiple countries, multiple economic regimes, and multiple generations of investors.
Where does 2026 sit on that cycle?
At the beginning of the next growth leg opening up.
The current period of uncertainty, rising costs, and softening sentiment is not the end of the Australian property story. It is the transition point. The part of the cycle that separates the investors who build long-term wealth from the ones who spend the next decade wishing they had acted.
The Investors Who Win Are Already Positioned
Here is the uncomfortable truth about the V-shaped recovery.
While you are living through the left side of it, it does not feel like opportunity. It feels like fear. It feels like caution. Every instinct tells you to wait until things feel better, until the RBA settles, until confidence returns, until the headlines turn positive.
But that is exactly when the window closes.
The investors who captured 13% to 25% growth in 2009 were not the ones who acted when confidence returned. They were the ones who acted while everyone else was frozen by fear.
What This Means for You Right Now
At Baker Advocates, our entire methodology, the Foundation8 Blueprint, is built around identifying structural high-growth opportunities before the market catches up.
The suburbs that are going to lead the next growth leg share specific characteristics:
Chronic undersupply with no pipeline relief in sight
Population inflows outpacing dwelling construction
Vacancy rates below 2%
Infrastructure investment creating long-term demand anchors
Affordability relative to comparable markets
These are the same conditions that defined the top-performing markets in 2009. And right now, we are finding them across multiple markets nationally.
The Question You Need to Answer
The V-shape only looks obvious in hindsight.
While you are living through the left side of it, it just feels like fear.
What side of the chart do you want to be on?
If you are ready to stop watching from the sidelines and start building a portfolio positioned for the next growth cycle, let's talk.
Book a Discovery Call with Troy Baker
Baker Advocates is a borderless buyers agency headquartered in Geelong, helping time-poor professionals and investors secure high-growth properties across Australia. Troy Baker is a Director and Buyers Agent with a decade of property investment experience and the creator of the proprietary Foundation8 Blueprint.
Data source: ABS (Australian Bureau of Statistics)
Tags: property investment, Australian property market, buyers agent, Geelong buyers agent, property market 2026, GFC property, 18.6-year property cycle, investment property Australia, property undersupply